

IoT data can speed up service processes, but fragmented data sources make field service more difficult. Technicians waste time because sensor data, service reports, and expert knowledge are scattered across different systems. This prolongs diagnostic times, increases the number of return visits, and makes service dependent on the expertise of individual experienced colleagues.
An integrated service console that consolidates IoT data, service history, and diagnostic knowledge offers a solution. It enables faster fault diagnosis, reduces the need for follow-up visits, and improves scheduling. By combining real-time sensor data, machine-specific knowledge, and digital support, technicians can often resolve issues on their first visit.
Problem: Fragmented data sources prolong diagnostic times and increase reliance on experienced staff.
Solution: A central service console consolidates sensor data, service history, and diagnostic information.
Result: Faster diagnoses, higher first-time resolution rates, and shorter downtime for customers.
logicline helped develop the Salesforce integrations for Empolis Service Express (knowledge management) and TeamViewer (remote support). This creates a unified work environment that supports technicians in making decisions on-site.
How a Unified Service Console Is Transforming Field Service
A central service console consolidates IoT sensor data, service history, and diagnostic knowledge into a single interface—tailored specifically to each machine. This integration reduces diagnostic times and increases the likelihood that problems will be resolved on the very first visit. The difference between today’s workflow and a future one clearly illustrates the benefits.
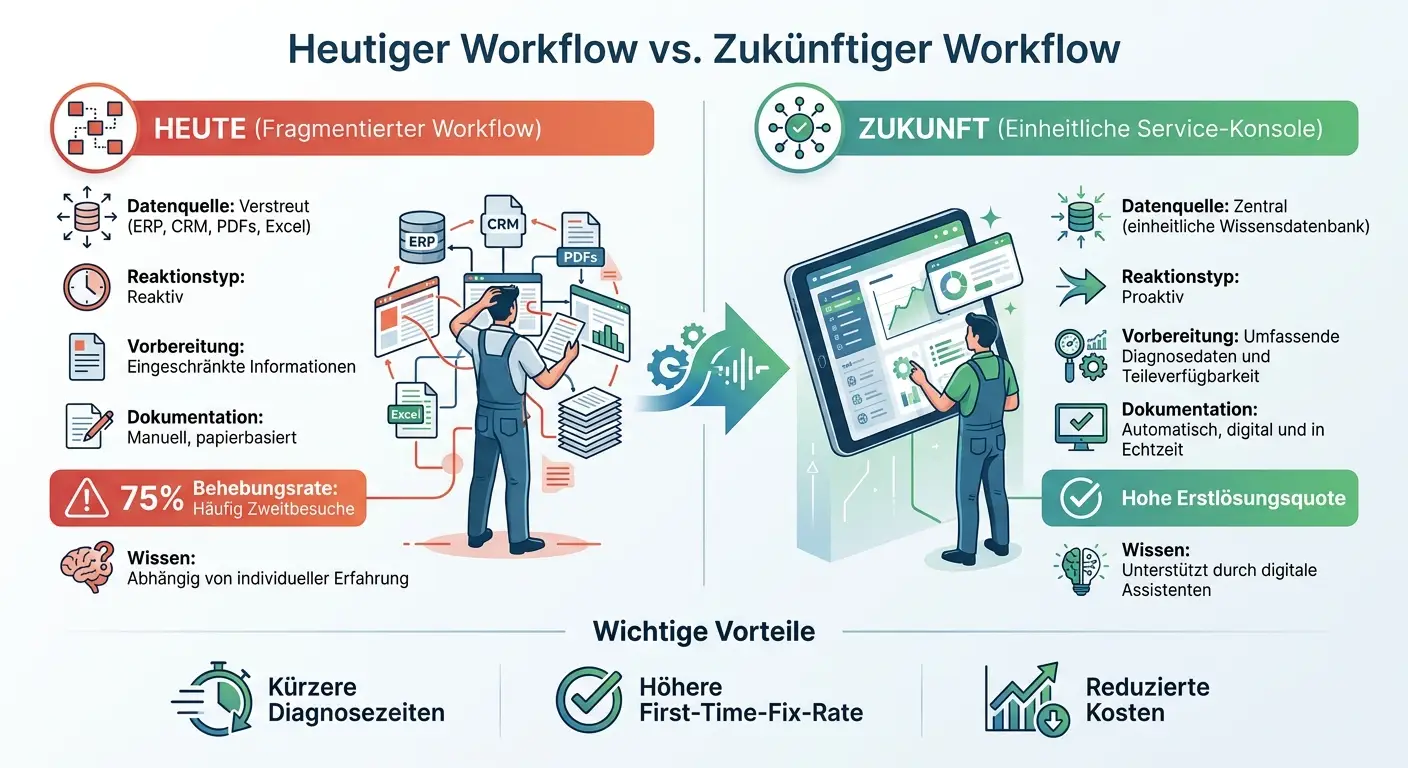
Today’s workflow vs. future workflow
Today: Technicians access various systems to gather the information they need. Live sensor data comes from the IoT platform, service history from the ERP system, and diagnostic knowledge is often available only in documents or in the minds of experienced colleagues. When uncertainties arise, the headquarters is contacted. Spare parts are ordered without knowing for sure whether they are available. This constant switching between systems costs time and leads to errors.
In the future: An integrated service console will fundamentally change this process. All relevant data—from current sensor readings such as temperature or vibration to the complete service history—is clearly displayed. Diagnostic recommendations are shown immediately. Technicians know right away which components have already been replaced and whether spare parts are available. With just one click, you can order spare parts or consult with remote specialists.
Feature | Today’s fragmented workflow | Future with a standardized console |
|---|---|---|
Data source | Scattered (ERP, CRM, PDFs, Excel) | Central (standardized knowledge database) |
Reaction type | Reactive | Proactive |
Preparation | Limited information on machine condition and parts | Comprehensive diagnostic data and parts availability |
Documentation | Manual, often paper-based | Automatic, digital and in real time |
Correction rate | Second visits often necessary | Higher first-time fix rate |
Knowledge | Depending on individual experience | Supported by digital assistants |
Advantages of an integrated solution
Integrating data from various sources addresses key challenges in Field Service. Diagnostic times are reduced, decisions are more informed, and onboarding new technicians is easier. The centralized view saves time by eliminating the need for time-consuming searches for information. Sensor data and service history can be analyzed together rather than in isolation. New employees benefit from digital diagnostic knowledge based on documented solutions from previous cases, rather than on personal experience.
Central knowledge databases alleviate the shortage of skilled workers. Technicians can refer to documented best practices from previous cases rather than relying on advice from colleagues. Entering measurement values, fault codes, and photos directly into the service console automates documentation and speeds up billing. Dependence on individual experience decreases, while service quality becomes more uniform. Thanks to the Salesforce integrations from Empolis and TeamViewer—which were co-developed by logicline—this central console becomes a practical tool for modern Field Service.
Find out just how far your service console can take you today—in 30 minutes.
We’ll use a real-world example to show you how IoT data, service history, and Empolis expertise come together in a single console. This isn’t just a slide presentation—it’s a live look at a similar implementation in the machinery and equipment industry.
→ Schedule an introductory call
Integration of IoT sensor data in real time
How sensor data gets into the console
Sensors on the machines continuously record operating data. This data is pre-processed directly on site (edge) and then transferred to a cloud environment via secure APIs. There, algorithms analyze both real-time and historical data to identify deviations that indicate possible failures.
As soon as an anomaly is detected, the system automatically forwards this information to the service console. The architecture combines edge computing components, a secure cloud gateway and stream processing for sensor data. Alarms are fed directly into the console via workflow automation.
Older machines can be retrofitted with external sensors. This allows them to be integrated into the IoT ecosystem without having to replace the entire system. Edge computing hubs store data locally if the internet connection is interrupted and synchronize with the cloud later. This ensures data availability.
This seamless integration of sensor data enables more accurate and efficient on-site fault diagnosis.
Using Real-Time Data for Faster Diagnosis
The data transmitted in real time enables technicians to take targeted action and be well-prepared. Even before the service call, they can identify the likely cause of the problem and plan for the necessary tools and spare parts. This saves time and increases the success rate on the first repair attempt.
The role of the technician is changing as a result: Instead of time-consuming troubleshooting, the work is increasingly focused on targeted repairs supported by clear data. Modern service consoles filter out only the relevant information for the respective machine and the specific problem – technicians are not flooded with irrelevant data.
In some cases, IoT connectivity even enables remote maintenance. Diagnoses and software updates can be performed remotely, eliminating the need for on-site visits. If a sensor detects values outside the defined parameters, the system automatically creates work orders and schedules a technician’s visit—often before the customer even notices the problem.
Add information about the diagnosis and service history
Real-time data forms the foundation, but it is only by supplementing it with expertise in diagnosis and service history that a comprehensive overview is created.
Empolis Integration: Leveraging Knowledge in a Targeted Way
Real-time sensor data shows what’s happening right now, but it doesn’t explain the “why” or the “how” of a solution. This is where the diagnostic expertise from Empolis Service Express comes into play. logicline helped develop the Salesforce integration for Empolis Service Express, ensuring that this expertise appears directly in the service console in a context-specific manner for the specific machine.
Instead of having to search through an entire manual, the technician receives exactly the information that corresponds to the current error message. In the event of a temperature deviation, for example, the console displays the relevant steps for diagnosis, 3D models of the affected component, and suggested solutions from similar cases. There is no need to switch between different systems.
Particularly in the case of special machines that vary greatly, integration ensures that knowledge does not just remain in the heads of experienced technicians. Thanks to the structured knowledge pool, even less experienced employees can access proven solutions, regardless of their previous practice. We describe how such a knowledge base is methodically built and maintained in the article .”
While machine-specific diagnostic information helps directly with troubleshooting, the service history provides additional insights from past service calls.
Service history: recognize patterns and act better
The complete service history – including all interventions, replaced parts, measured values and repairs carried out – is brought together in a single view. This allows the technician to immediately recognize whether a problem is new or has already occurred several times.
For example, if a sensor reports unusual vibrations, the service history shows that the affected bearing was only replaced six months ago. Instead of replacing the bearing again, the technician examines the foundation and discovers the actual cause. Without this historical perspective, the fault might have been treated several times without solving the underlying problem.
Digital service reports, created directly on-site, capture all relevant data, such as measurement values, diagnoses, and photos. This information is automatically incorporated into the machine’s service history and is available for future service calls—regardless of which technician is working on the machine. This reduces reliance on individual experts and shortens the training period for new employees.
With this expanded database, technicians can not only identify problems more quickly, but also solve them more sustainably.
Escalate complex cases with a click
If the on-site technician’s knowledge isn’t sufficient, they can escalate the issue to a remote specialist with a single click from the service console. logicline helped develop TeamViewer’s Salesforce integration —the escalation path is part of the same console; there’s no need for a second system. With a single click, a remote connection is established, and the specialist immediately accesses the same information available to the on-site technician: live sensor data, service history, and diagnostic recommendations from Empolis Service Express.
This integration shortens response times. The remote expert does not have to spend time searching for information, as all relevant data is available in a shared view. In addition, the entire escalation process is automatically documented in the service report, which ensures traceability.
Example: Solving a complex case with remote help
A typical scenario illustrates the benefits:
A technician is standing in front of a special-purpose machine that is exhibiting unusual vibrations. The sensor readings show anomalies, but the service history contains no comparable cases. The diagnostic suggestions from Empolis provide several possible causes, but no clear solution.
Thanks to the built-in escalation option, the technician can quickly resolve the situation: Instead of accepting prolonged downtime or unnecessary component replacements, he escalates the case to a specialist with a single click. The specialist analyzes the live data, compares it with similar machines at other locations, and identifies a calibration error that occurred following a recent maintenance visit. Together, they perform the recalibration—the machine is up and running again without the need to order spare parts or schedule a second service call.
Without this integrated escalation option, the downtime would have been longer and unnecessary costs could have been incurred. The combination of contextual data and direct expert access makes the difference between a quick solution and a lengthy troubleshooting process.
Results: Shorter diagnosis times and higher first-time-fix rates
The integrated workflow helps reduce diagnostic times. At the same time, the first-time-fix rate increases because technicians know which spare parts and tools are needed even before they arrive on site. Follow-up visits are a reality in many maintenance situations today—an inefficient and costly process that can be reduced through integrated data views.
Advantages for field service teams
The resulting efficiency gains bring tangible benefits. Technicians work faster on-site because time-consuming research is no longer necessary. The head of service benefits: fewer return visits mean lower costs, and spare parts can be used more effectively. For customers, this means shorter downtime and a more consistent level of service—regardless of whether a junior or senior technician handles the job.
A typical scenario from the machinery and equipment sector illustrates this: The service team of a specialty machinery and equipment manufacturer receives an automatic error message from a production line via the IoT console—a significant refrigerant leak is identified even before the technician heads out. The technician brings the necessary refrigerant and nitrogen with him and restores operations within a day. Without the data available in advance, several visits—and thus days of downtime—would typically have been necessary.
Next step
Service technicians with fragmented data sources is not a tooling problem, but a data problem. Every hour a technician spends searching costs first-time fix rate and ties up experienced colleagues who are needed elsewhere.
logicline’s Digital Machine File serves as the structured database for an integrated service console—lifecycle data, IoT integration, and configuration history in Salesforce. Behind the scenes, Service Decision Intelligence (SDI) links the data sources; every recommendation includes a source citation, and data sovereignty remains with the manufacturer.
Two pragmatic approaches:
Installed Base Assessment — if your machine data is currently scattered and you first need a structured foundation. 4–6 weeks, clearly defined, with a concrete leverage report at the end.
introductory call — once the data foundation is in place and you want to assess specifically what an integrated service console would look like for your Field Service organization.
