

Three vendors demonstrated their service AI this fall, and all three were impressive. The AI identifies the fault, specifies the appropriate spare part, and points to the relevant section in the service manual. In a typical scenario, the manufacturer has about 3,000 machines in the field, and in January, the budget for the next year is allocated. The head of service asks the question that no demonstration can answer: How often would the system have been correct in our own cases?
This question can be answered before any money is invested in a project. All it takes are closed service cases with known causes and a test designed to hold up under scrutiny. Here’s a quick overview of what matters:
- Closed cases from a specific series used as a test set. Twelve to 24 months, cause documented, and the same set for each provider.
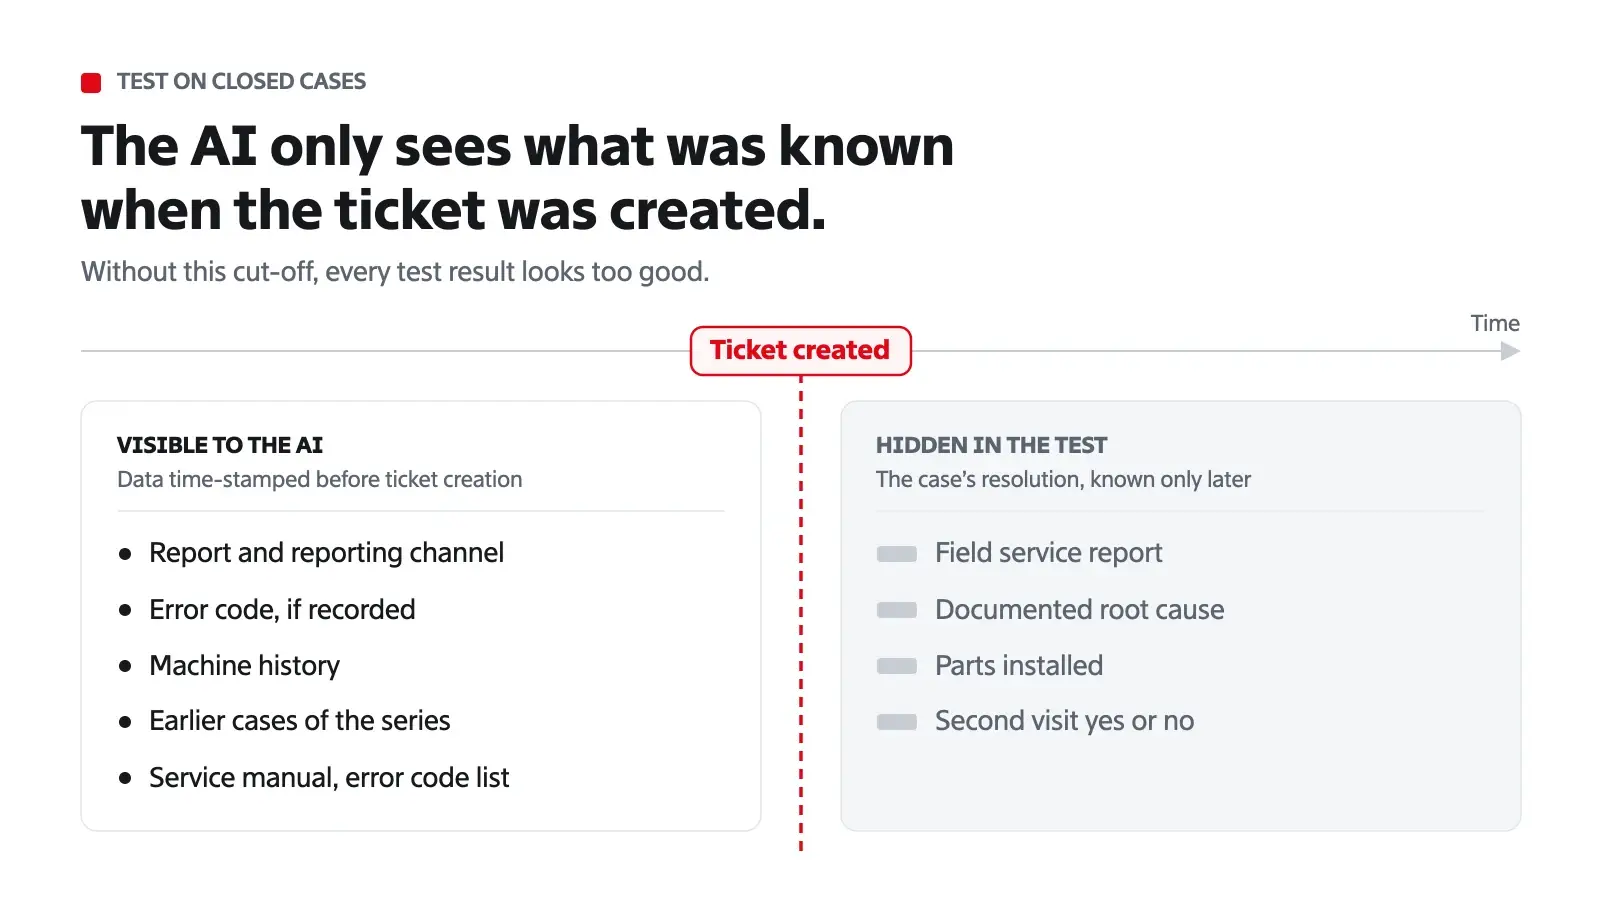
- The AI only sees what was known when the ticket was created. Solution fields and subsequent entries remain hidden; otherwise, every result will appear too favorable.
- Cases without a documented cause are counted but not evaluated. Their proportion says a lot about the quality of your own case documentation.
- An in-house technician evaluates the cases blindly, and the confidence values are recounted. Only then do you know whether you can trust a value of 80 percent.
Want to know how a service AI performs on your closed cases?
In the backtest, we evaluate this on a specific machine type over a period of three to four weeks, without accessing your production systems. The result may even show that it’s not quite ready yet.
→ Backtest on the SDI product page
Why a demo tells you little about your actual cases
Demos run on cases that someone has selected. The report is complete, the serial number is correct, the fault code is maintained, and there is a clean history for the machine. Under these conditions, many systems provide good results today.
In the field, a service call looks different. The report comes in by phone; the serial number is missing, and the fault code is either listed in the free-text field or not listed at all. The technician eventually noted the cause in the service report, and the replaced part is linked to the work order rather than the service case. No demonstration can show whether an AI can handle this kind of data.
That is also the point where many companies hesitate. In the latest Bitkom survey, 40 percent of companies that do not yet use AI cite the poor quality of results as a barrier; among companies that already use AI, the figure is 26 percent (Bitkom Research 2026, 603 companies surveyed). This concern can only be assessed using your own data. A demonstration shows what a system is capable of; a test using your own cases shows what it can do for your company.
The test set: a product series, closed cases, one set for all
A meaningful test begins with the selection process. The most suitable option is a product line with many machines in the field and for which inside sales regularly receive reports. From this series, select the closed cases from the last 12 to 24 months—typically 150 to 300 cases—including a mix of simple malfunctions and complex cases that required multiple service calls.
This approach works well for a fleet of identical machines. However, if you’re servicing twelve custom-built systems, you won’t be able to derive reliable statistics from your cases because almost no two cases are alike.
What Belongs in the Export Section
For each case, the following information is required: what was known at the time of the report and what came to light afterward:
- Subject, description, reporting channel, and date the case was filed
- the machine, including serial number, build status, and commissioning date
- Fault code, if recorded, and the case history of this machine prior to the report
- The documented cause, the work orders listing the parts installed, and information on whether a follow-up service visit was necessary
- In addition, for the model series: the error code list, the service manual, and the maintenance records
An export is sufficient. No one needs access to the production system for the test, and personal data can be pseudonymized during import.
One test set for all providers
If you want to compare multiple systems, give them all the same set of data, with the same rules regarding what the AI is allowed to see, and using the same evaluation criteria. If each provider brings its own sample cases, the comparison ultimately boils down to the selection of cases. Our article on the Agentforce pilot in the Service section describes how such a “rearview mirror” test is conducted as part of an agent pilot. The question here is when the numbers hold up.
Four Mistakes That Skew the Results
A test for completed cases is quick to set up. It also quickly returns a number that’s too good to be true. Four errors are to blame, and all four can be spotted in the report if you know what to look for.
| Error | How to identify it in the report | What to Do About It |
|---|---|---|
| The AI sees what wasn’t known until later | Matches even in cases where the report contained very little information | For each case, only data prior to ticket creation; hide solution fields |
| Cases with no documented cause disappear | A hit rate without specifying how many cases were evaluated | These cases are counted and reported, but not evaluated |
| Grading is based on knowledge of the AI’s response | Borderline cases are consistently decided in favor of the AI | An experienced technician evaluates a random sample blindly |
| Confidence Intervals Without Re-testing | Almost every recommendation has a value around 80 or 90 percent | For each confidence interval, count how often the recommendation was correct |
Just show what was known at the time
Here’s an example from a typical scenario: A case was created with the description “Temperature not reached.” Three days later, the incident report states “Heating element replaced,” and the part that was installed is attached to the work order. If the AI is shown the entire case during testing, it finds the answer within the case itself and gets it right. This says nothing about its ability to narrow down a malfunction.
That is why there is a cutoff point for every case: the time the ticket was created. The AI is allowed to use everything with a timestamp prior to that point—that is, the report, the machine’s history, previous cases involving the same model series, and the documentation. Everything after that remains hidden. Without this rule, every result is inflated—and the more meticulously the technicians document, the more exaggerated the results become.
Cases without a cause are counted rather than evaluated
Many case records end with “resolved,” “customer is no longer in contact,” or a free-text note that does not indicate the cause. Such cases cannot be evaluated because no one knows what the correct answer would have been. If they are quietly set aside, the success rate looks better than it actually is. If they are counted as errors, it looks worse.
The correct approach is to report them separately. Their proportion is a metric in itself—and often the most revealing one in the entire test: It shows how much knowledge from closed cases is lost today, regardless of which system processes them later.
Blind grading and recounting confidence scores
An experienced technician can tell within seconds whether a hypothesis about the cause holds up technically. However, to do so, the technician should not know what the AI suggested or how the automated assessment turned out. A sample of 40 to 50 cases is sufficient. A good report also shows the extent to which the technician’s assessment differs from the automated evaluation.
Many systems provide a value for each recommendation, such as 82 percent. This value generally describes how well the recommendation is supported by data. It only becomes a probability of accuracy once it has been verified: Out of 100 recommendations with a value around 80 percent, approximately 80 should have been correct. This verification is called calibration, and testing it against completed cases is the simplest way to perform it.
This applies to every system, including ours. A confidence score is only useful for decision-making if it presents both supporting and counterarguments and if we know how often it has been accurate in the past. The article “AI in Customer Service with Its Own Knowledge Base” explains why an AI system in customer service needs its own knowledge base.
What Should Be on the Table in the End
Two parts of a useful report
The first part is the measurement. This includes, for each evaluable case:
- how often the actual cause was the first suggestion and how often it was among the top three
- how often the correct spare part was suggested
- Which on-site service calls, in the technician’s estimation, could have been avoided
- what percentage of cases exceeds a specified confidence threshold and how well the values are calibrated
- A projection based on your own cost rates, with assumptions clearly disclosed
The second part is an analysis of the case data. It shows which gaps are limiting the hit rate and in what order it’s worth closing them: causes that appear only in free-text fields, parts unrelated to the case, fault codes that aren’t maintained, and knowledge that resides in manuals or with individual technicians and never makes it into the system. Some gaps can be closed by a required field in the completion dialog; others require follow-up work on the existing data. The article on data maturity in service explains why AI projects in service so often get stuck right here.
This second part has value that extends beyond the purchase decision. It applies to every tool that will later be used to work on the service data. And it reveals the knowledge contained within the installed base: Every clearly documented case improves the next diagnosis on a machine of the same design.
Three Possible Outcomes
An honest test can end in one of three ways:
- Hit rate and data availability. This is followed by a pilot test on this model series, and the results from the test serve as the baseline against which the pilot must be evaluated.
- The method is sound, butthe data is not yet sufficient. First, the measures from the second part of the report will be implemented, followed by a repeat test based on the same criteria.
- Not a good fit at this time. With justification, and no follow-up project.
A test that can only end with the first outcome is a sales pitch. Therefore, ask every provider in advance how they would report on the third scenario.
Conclusion: measure first, then budget
You can determine whether a service AI will be effective for your machines before making a budget decision. This requires completed cases from a specific model series, a clear cutoff point at the time the ticket was created, a separate breakdown of cases without a cause, a blind random sample, and recounted confidence values. Using these rules, three compelling demonstrations can be turned into a comparison based on your own data.
logicline offers this Service Decision Intelligence (SDI) test as a backtest: one machine type, three to four weeks, fixed price, read-only. Each recommendation is accompanied by supporting evidence, counterarguments, and identified data gaps, so the report clearly explains why a particular answer is correct or incorrect. The run takes place in an isolated tenant within the EU, and your data will be deleted upon completion. Two entry points, depending on your starting point:
- Backtest on the SDI product page – if your service cases are documented in the system and you want a quantified figure before making a budget decision.
- Installed Base Assessment – when machines, service cases, and contracts are currently spread across multiple systems and you first need to determine which data is actually available at the machine level.
Start with the product series for which the inside sales team receives the most reports. That’s where the number of cases is highest and the data is most reliable.
