
Selling Services to the Installed Base
What data you need for each machine, what sales opportunities arise from it, and how marketing, sales, and service work together to address them. For the head of service and service sales.
PDF · 12 pages · English · 2026 (no registration required)
The difference lies in access to the machine
Manufacturers with a proactive, contract-driven service model generate an average of 48 percent of their EBIT from service, while competitors with a reactive approach generate about 15 percent. Both sell the same services. One group knows which machine will require service and when; the other waits for the call.
- 48% EBIT contributionfrom services under a proactive, contract-driven model (Roland Berger/KVD 2026)
- 15% EBIT contributionwith a reactively organized service model (Roland Berger/KVD 2026)
- 8Dataper machine is sufficient; the first four decide
- 90 daysfor a machine type and two occasions until the first measured result
The Five Key Messages
The installed base is a sales list.
For this, eight pieces of information per machine must be correct—not eighty.
Sales triggers are finite and identifiable.
Ten of these cover most scenarios, from warranty expiration to recurring malfunctions, each triggered by existing data.
An opportunity without an assigned person in charge will not be processed.
The three handoffs between marketing, sales, and service decide more than any tool.
The technician is the most credible voice in service sales.
They see the condition of the equipment, recurring faults, and unused features; most of the time, this information isn’t fed back anywhere.
One machine type is enough to start with.
If you wait for complete data on the entire portfolio, you’ll never get started.
Key figures: Roland Berger/KVD 2026, McKinsey, BCG.
Ten Sales Triggers and How to Spot Them
| Reason | Triggers from the data | What You Offer |
|---|---|---|
| End of Warranty | Commissioning plus warranty period, 90-day lead time | service contract |
| Contract Expiration | Contract end date minus 90 days | Renewal, higher contract tier |
| Maintenance Due Date | Interval or operating hours reached | Maintenance service with parts package |
| Wear Part Cycle | Last installation plus typical service life | Spare Parts or Stock Package |
| Recurring Issue | Multiple incidents involving the same asset within a short period of time | Repair, retrofit, operator training |
| Age and Technology Level | Year of Manufacture and Model Status Compared to Current Model Line | Retrofit, Modernization, Replacement |
| Change of Ownership or Location | Changes to master data, note from the technician | Commissioning check, training, new contract |
| Staff Changes at the Client’s Site | Frequent operating errors, training requests | Training, assistance, and access to knowledge |
| Unused Features | Configuration vs. Actual Use | Activation, Expansion, Training |
| Downtime Without a Ticket | Decline in Telemetry Usage | Call and Investigation of the Cause |
The first four are enough to get started. All you need are the serial number, delivery date, build status, and current operator—these cover every machine in your inventory and can be set up as a rule that continuously generates lists. These four pieces of information are often already available, but scattered across ERP, CRM, and contract management systems. The Digital Machine File shows how they can be brought together in one place.
What You'll Find on 12 Pages
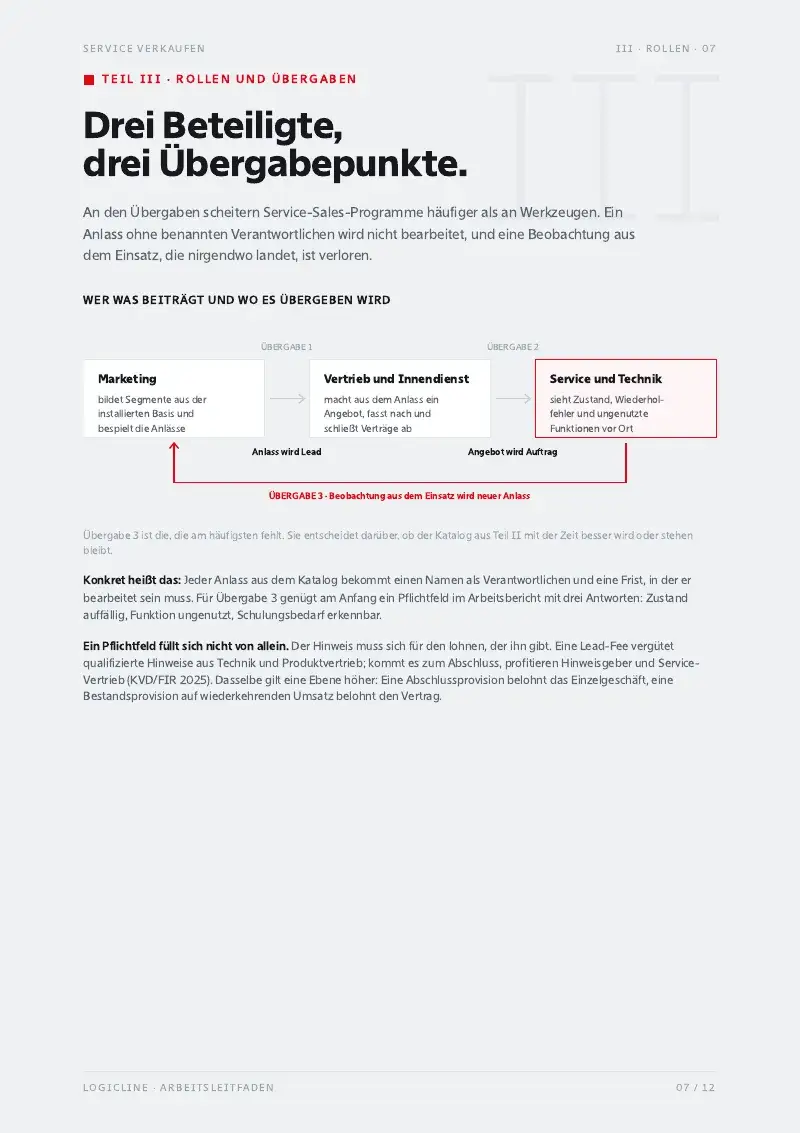
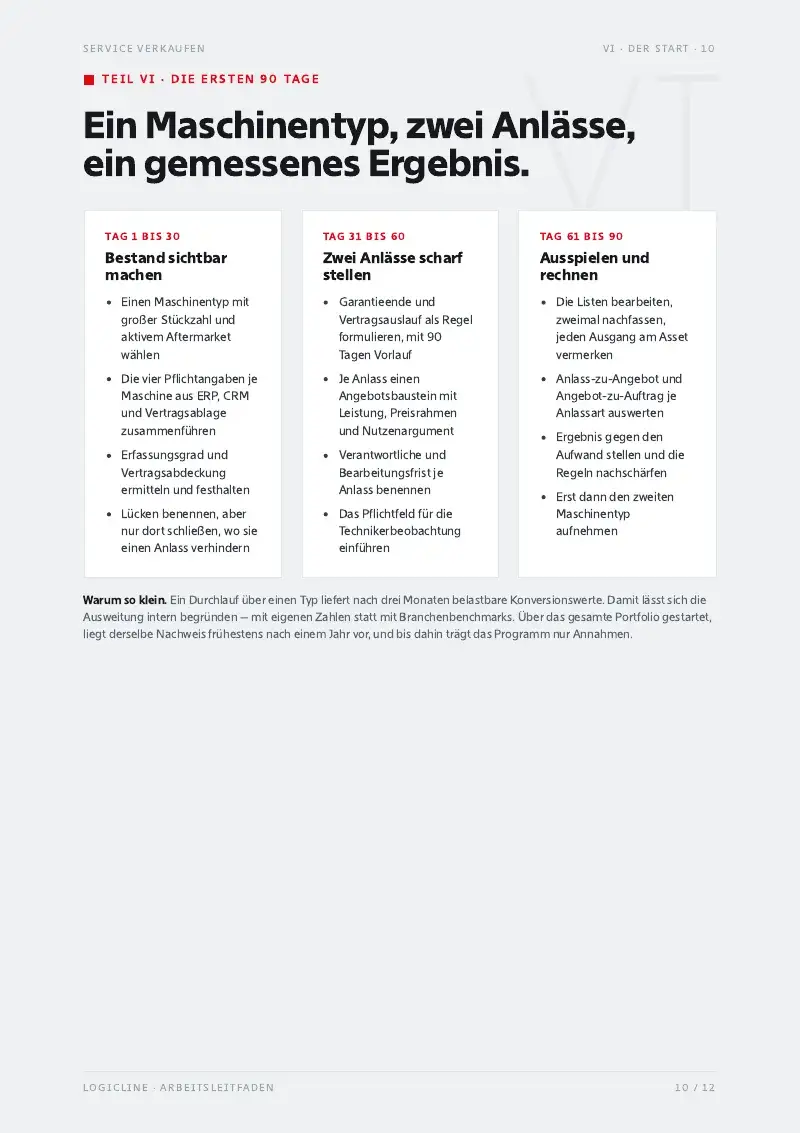
- Part I · The Basics (pp. 3–4): eight pieces of information for each machine, where they are typically located, and which four decide
- Part II · The Triggers (pp. 5–6): when a machine generates triggers over its runtime, and the catalog above
- Part III · Roles and Handoffs (p. 7): who contributes what, three handoff points, a lead fee for technical input
- Part IV · From Opportunity to Order (p. 8): list, quote, follow-up, feedback—each with a checkpoint
- Part V · Key Metrics (p. 9): seven metrics, two of which are sufficient to start with
- Part VI · The First 90 Days (p. 10): One Type of Machine, Two Scenarios, One Measured Result
- Six Common Pitfalls (p. 11): From “Waiting for Complete Data” to “Lists That No One Can Work Through”
| For | Head of Service and Service Sales for machinery, systems, and equipment manufacturers |
| Length | 12 pages, about 15 minutes reading time |
| Author | Edgar Schüber, CEO and founder of logicline |
| Sources | Roland Berger/KVD 2026, McKinsey, BCG, KVD/FIR 2025, Argon & Co 2026, Advyce 2025 |
If you'd like to continue
Service for machinery and equipment manufacturers: The Underestimated Business
This guide assumes that you have already decided to use the service. The white paper uses market data, implementation paths, and a business case to show whether and why the expansion is worthwhile.
Installed Base Assessment
If Part I is the hurdle: how comprehensively your installed base is tracked and what opportunities can be derived from it today.
Service Data Readiness Check
Ten questions, about five minutes. You’ll see right away which area is holding you back the most.
Read more in the magazine: The Installed Base as a Business Model. New guides are published first in the LinkedIn newsletter Service!Digital.
