Aftermarket Potential per Machine: Why the Revenue Gap Can Only Be Explained with Service Data
Contents
Management wants to know how much service revenue is generated by the installed base. Six weeks later, a presentation is on the table: a customer list, average figures by machine type, and a heat map based on machine age. Six months later, someone asks what happened to those opportunities. No one can say, because the list never made it into the system used by Sales and Service.
Measuring the aftermarket potential of an installed base is fairly straightforward today. More difficult are the two questions that follow: Why is revenue missing for this specific machine? And who will handle this starting tomorrow, and in which system? Here’s a quick overview of what matters:
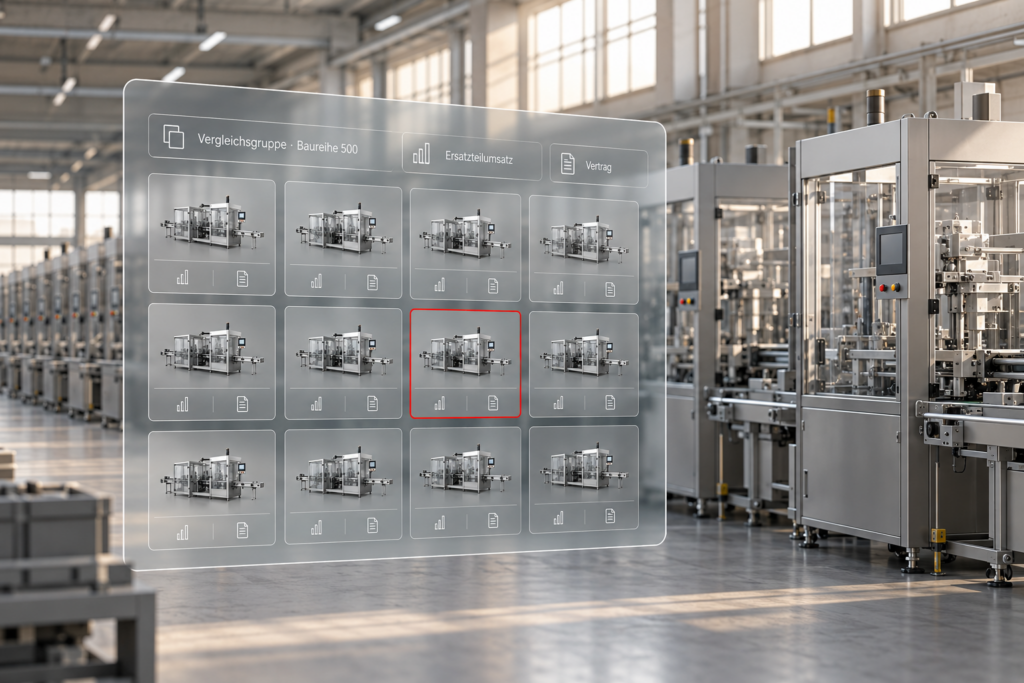
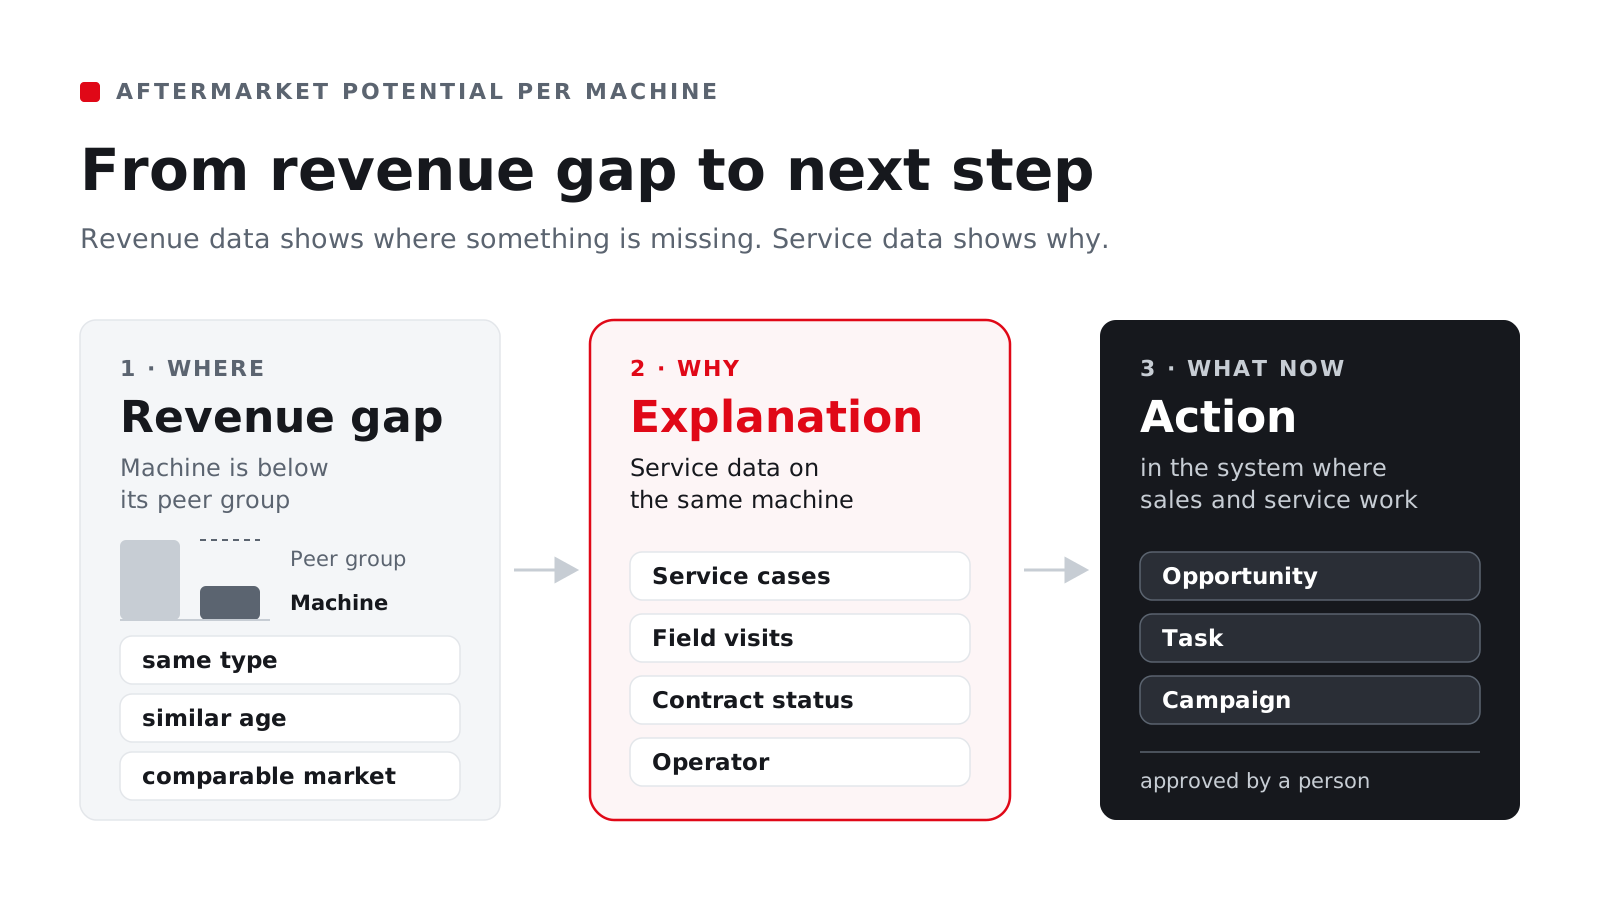
Comparison group instead of overall average. Potential only becomes apparent when machines of the same type, similar age, and comparable market value are placed side by side.
The revenue gap needs an explanation. Whether a customer buys parts elsewhere, there is no contract, or the machine has changed operators is only revealed through service calls, field visits, and contract status.
The result belongs to the machine. The potential and rationale are listed as values in the machine file, where anyone who deals with the customer can find them.
The value becomes an action. Opportunity, task, or campaign—initially a suggestion that a person approves.
Do you know that there’s revenue potential in your installed base, but aren’t sure which machines it comes from?
In 30 minutes, we’ll take a look at a product line with many machines in the field: what data you already have for a comparison, where the mapping breaks down, and what patterns emerge first.
→ Schedule an introductory call
Why One-Time Potential Assessments Fall Flat
The data describing a machine in the aftermarket is almost never stored in a single location. Spare parts invoices are stored in the ERP system, posted to the customer and rarely to the serial number. The operator and their contacts are stored in the CRM. Service calls and malfunctions are documented by the service software, while the delivery configuration is stored in the PLM. Each system has its own number ranges.
A capacity analysis compiles this data all at once, usually involving a great deal of manual work. The result is a snapshot of the situation as of a specific date. After that, new orders come in, machines are sold or relocated, and contracts expire. After three months, the list is no longer accurate, and updating it would require the same manual work all over again.
Yet the importance of this business is undisputed. In the machinery and equipment sector, service accounts for more than a quarter of revenue, and while product revenue may plummet by about 30 percent, service revenue falls by only 5 to 8 percent (Roland Berger / KVD 2026). Nevertheless, the installed base remains a blind spot in many companies: known in aggregate, but unknown on an individual machine basis. That is why even the best one-time analysis is wasted if its results are not permanently attached to the machine.
Measuring Aftermarket Potential: Comparison Groups by Machine Type, Age, and Market
Taking an average across the entire installed base is of little help. A three-year-old machine has different needs than a twelve-year-old one, and a packaging line in Poland has different needs than the same line in Switzerland. The comparison only becomes meaningful when made within a comparable group: same machine type, same age range, comparable market.
Within this group, revenue per machine is compared by category, such as spare parts, service calls, maintenance contracts, upgrades, and rebuilds. The difference from the group average represents the calculated potential. A typical pattern often emerges: Newer machines generate revenue primarily through spare parts and service, while older machines increasingly generate revenue through rebuilds, upgrades, and modernization.
The calculated potential represents an upper limit. Some operators have their own maintenance teams with manufacturer training; some machines operate on a single shift and wear out more slowly than the group average. Therefore, every discrepancy requires a plausibility check before it is turned into a work order. This check is performed by the service data in the next step.
This process requires a fleet. With 2,000 machines of a given model in the field, the comparison groups are valid; with twelve individually built systems, they are not. For mass-production manufacturers with a large installed base, this is therefore the obvious starting point.
What data is required for this
Data Point
Typical source
Typical gap
Serial Number and Machine Type
ERP, PLM
Different numbers for the same machine in different systems
Operator and Location
CRM, ERP
Outdated following resale or relocation
Commissioning or Year of Manufacture
Delivery, PLM
Often blank for legacy inventory
Spare Parts and Service Revenue
ERP invoices
Posted to the customer, not to the machine
Contract Status
CRM, ERP
Framework agreement covering multiple machines without assignment
Service Cases and Calls
Service Software
Case recorded without a serial number
Gaps should be clearly identified. Machines with an unknown year of manufacture should be grouped separately, rather than using estimated values that skew the average. Often, this group itself is indicative of a problem: When the year of manufacture is missing, contact with the current operator is usually missing as well.
Explaining the Revenue Gap: What Service Data Reveals
The sales data show that a machine is underperforming compared to its peer group. However, the data do not reveal the reason. That reason can be found in the service cases, the operational report, the contract status, and sometimes in who last reported on the machine. Three patterns repeatedly emerge in practice.
Aftermarket parts, yes; genuine parts, no
A typical scenario: The machine requires regular service calls and maintenance visits, but spare parts sales are well below the group average. So the machine is running and needs parts, but those parts are coming from elsewhere. Possible causes include aftermarket parts, the operator’s own inventory, or orders placed through another company. The logical next step is to talk to the customer, often followed by a spare parts package with a availability guarantee.
Old machine, incidents are piling up, no contract
The machine is more than ten years old; there have been several incidents involving the same assembly in recent months, and there is no maintenance contract in place. A rebuild or upgrade offer would be appropriate here, or alternatively, a maintenance contract. The rationale is already documented in the case history, making the offer clear to the customer.
The serial number appears when a new operator takes over
A serial number is associated with an inquiry or order from a company that is not listed as the owner in the file. The machine has been resold. The new operator often has no documentation and no relationship with the manufacturer. For the aftermarket, this represents a new customer in its portfolio, with a need for inspections, training, and spare parts.
What all three patterns have in common is that they only become apparent when revenue, service cases, and contracts are linked to the same machine. With revenue lines alone, one can only conclude that something is missing.
The revenue gap reveals where the potential lies. Only the service data explains why there is a shortfall and determines the next step.
From Opportunity to Transaction in the Service Process
To ensure that a finding doesn’t just end up as a slide, it is saved in the machine’s record: the potential per category and the rationale. In the Digital Machine File (IOTAM), each machine has a data record that includes the model series, configuration, operator, contracts, and service history. Because the machine file is stored in Salesforce, opportunities, contracts, service cases, and service calls are already linked to the same customer and, in most cases, to the same machine. This means the potential ends up right where sales and service teams are already working.
Based on this value, specific actions are generated through rules. If a machine is significantly below its group’s average and does not have a contract, the service sales team is assigned a task. A clear candidate for a rebuild becomes an opportunity. Many similar cases in a market result in a segment for a service sales campaign.
The person in charge is the Service Sales representative who already handles the customer. They identify the potential when the account is opened, along with any open cases and active contracts. A central office maintains the rules and reviews them once a quarter to determine which ones are effective and which ones merely create extra work.
Service Decision Intelligence (SDI) provides the explanation. SDI links a machine’s revenue gap to its case, service call, and contract history and supports each recommendation with a source citation—that is, with the specific data records on which it is based. SDI runs on the customer’s infrastructure, is EU-compliant, and is independent of the language model. The same questions can also be asked via Claude, Agentforce, or other AI interfaces without copying the data.
Automation is automated in stages. Initially, the system makes recommendations, and a human in the service sales department approves them. Only once it becomes clear which rules consistently apply do individual processes run without approval. For quotes sent to customers, approval is generally still required.
Because every process is tied to a machine, it’s possible to measure the impact: identified potential, processed orders, and new business won each quarter. This also makes it possible to answer the question of what has changed after one year. The effort is worth it: Manufacturers with a proactive, contract-driven service model generate an average of 48 percent of their EBIT contribution from service, while those with a reactive approach generate about 15 percent (Roland Berger / KVD 2026). More on these figures can be found in the article “Service in Machinery and Equipment: The Underestimated Business.”
Where to Start
The process follows these four steps: Digitize → Connect → Decide → Automate. Digitization means that every machine is assigned a clean data set. Connecting means that revenue, service cases, and contracts are linked to this data set. Decide means that a comparison group and an explanation show where and why revenue is missing. Automate means that proven rules give rise to processes that require no manual intervention.
The greatest effort is required in the first two stages, and that’s where it pays to start small: a product line with many machines in the field and a solid data foundation. That’s where the comparison groups come into play, and the first patterns emerge quickly. The article on the installed base as a growth driver describes how this fits into an ongoing service organization.
Two pragmatic approaches:
Installed Base Assessment – when machines, operators, and revenue are currently scattered across ERP, CRM, and Excel. The assessment shows which data is sufficient for comparison and where the mapping breaks down.
introductory call – once the data is in place and you want to determine which series and rules the pilot will use to get started.
Start with the model series that has the most machines in the field. That’s where the potential is greatest and the comparison is most reliable.
FAQs
What data is needed for an aftermarket potential analysis?
For each machine: the serial number along with the machine type, the current operator, the year of manufacture or commissioning, spare parts and service revenue, contract status, as well as service cases and service calls. It is crucial that this data be linked to the serial number of the same machine. Revenue that is posted solely to the customer is not sufficient for a comparison on a per-machine basis.
How do you create a meaningful comparison group for machines?
From machines of the same type, similar age, and comparable market—for example, the operator’s country or industry. The group must be large enough so that individual outliers do not skew the average. For this reason, the method is particularly well-suited for mass-production manufacturers with many similar machines in the field.
What should you do if the year of manufacture or customer assignment is missing?
Clearly identify gaps rather than filling them with estimates. Machines with an unknown year of manufacture form a separate group. Missing assignments are often a finding in themselves, because in most cases there is also no contact with the current operator. An Installed Base Assessment shows which gaps are critical for the comparison and which can be closed later.
How can you tell if customers are buying spare parts elsewhere?
A clear indicator is a machine that requires regular service or maintenance but whose spare parts sales are well below those of the comparable group. The machine needs parts, but they’re not coming from the manufacturer. This becomes apparent only when service data and spare parts sales are linked to the same machine.
Should quotes be generated automatically based on the analysis?
Not from the very beginning. Initially, the system suggests processes, and a person in service sales approves them. Once it becomes clear which rules consistently apply, internal processes such as tasks can be generated automatically. For quotes sent to customers, approval is generally still advisable.
Hinweise zum Datenschutz
Um Ihnen ein optimales Nutzererlebnis zu bieten, verwenden wir auf unserer Website Technologien wie Cookies, um Geräteinformationen zu speichern und/oder darauf zuzugreifen. Wenn Sie diesen Technologien zustimmen, können wir Daten wie das Surfverhalten oder eindeutige IDs auf dieser Website verarbeiten. Wenn Sie Ihre Zustimmung nicht erteilen oder zurückziehen, können bestimmte Merkmale und Funktionen der Website eingeschränkt sein.
Funktional
Always active
Die technische Speicherung oder der Zugang ist unbedingt erforderlich für den rechtmäßigen Zweck, die Nutzung eines bestimmten Dienstes zu ermöglichen, der vom Teilnehmer oder Nutzer ausdrücklich gewünscht wird, oder für den alleinigen Zweck, die Übertragung einer Nachricht über ein elektronisches Kommunikationsnetz durchzuführen.
Preferences
The technical storage or access is necessary for the legitimate purpose of storing preferences that are not requested by the subscriber or user.
Statistiken
Die technische Speicherung oder der Zugriff, der ausschließlich zu statistischen Zwecken erfolgt.The technical storage or access that is used exclusively for anonymous statistical purposes. Without a subpoena, voluntary compliance on the part of your Internet Service Provider, or additional records from a third party, information stored or retrieved for this purpose alone cannot usually be used to identify you.
Marketing
Die technische Speicherung oder der Zugriff ist erforderlich, um Nutzerprofile zu erstellen, um Werbung zu versenden oder um den Nutzer auf einer Website oder über mehrere Websites hinweg zu ähnlichen Marketingzwecken zu verfolgen.